

The Unequal States of America
Income inequality
in the United States
Income trends have varied from state to state, and within states.
But a pattern is apparent: the growth of top 1% incomes.
Explore inequality in this interactive feature.
But a pattern is apparent: the growth of top 1% incomes.
Explore inequality in this interactive feature.
$1,153,293
Average annual income of the top 1%
$45,567
Average income of everyone else (the bottom 99%)
25.3x
The top 1% makes 25.3times more than the bottom 99%
What you need to make to be in the top 1%: $389,436
The top 1% takes home 20.1% of all the income
in the United States.
1% of the families

20.1% of the income

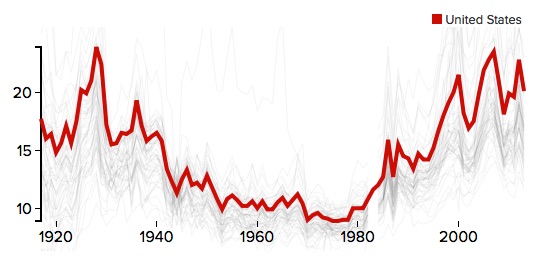
Share of income captured by the top 1%,
1917–2013
The share of all income held by the top 1% in recent years
has approached or surpassed historical highs.
Inside the United States
Metropolitan areas
- Jackson, WY-ID is the most unequal metro area in the United States.
- The top 1% there makes 213.0 times more than the bottom 99%.
- Average income of the top 1% in Jackson, WY-ID is $19,995,834.
- The average income of the bottom 99% is $93,891.
Counties
- Teton County, Wyoming is the most unequal county in the United States.
- The top 1% there makes 233.0 times more than the bottom 99%.
- Average income of the top 1% in Teton County, Wyomingis $28,163,786.
- The average income of the bottom 99% is $120,884.
See inequality numbers for all counties [+] or metro areas [+]
Adapted from Estelle Sommeiller, Mark Price, and Ellis Wazeter, Income inequality in the U.S. by state, metropolitan area, and county, an Economic Policy Institute report published in June 2016. Data are for tax units (single adults or married couples), referred to in the report as families, and for 2013, unless otherwise indicated.